

Creating a Organizational Chart
ConceptDraw PRO is perfect for drawing organization and workflow charts.
So we describe how you can create an organizational chart by using ConceptDraw PRO.
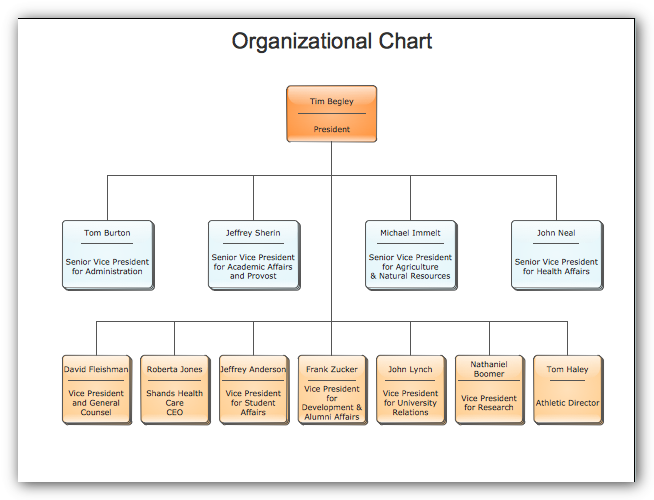
The resulting chart will look as follows:
Let's start creating the organizational chart.
We are going to use templates to speed up the work. In the File menu choose Template Gallery.The Template Gallery dialog will come up, where you can choose the needed template. Select the "Organization Charts" category in the left part of the dialog, and the "Organization Chart - simple" template.
Click Ok. A new blank document will be opened.
You will see the library window with open libraries. We'll need the "Organization Chart" library. Activate it by clicking on its title bar. You will see library shapes which can be used for drawing an org chart.
To place a library shape on the page, you may use 2 methods. You can either drag a shape from the library with the mouse, and drop it on the page, or you can use the Stamp tool. The second method is convenient when you need to use the same library shape many times in the document. On the Drawing Tools toolbar, select Stamp Tool and select the needed shape in the library. Then click on the document page where you want the shape to be inserted. The selected library shape will be inserted where you clicked.
In the library, choose the shape with this icon: and place it on the page as described above. Now you need to add text to the shape. Select the shape in the document and type "Headquarters".
Repeat this for all other departments.
In the result, you should get the following scheme:
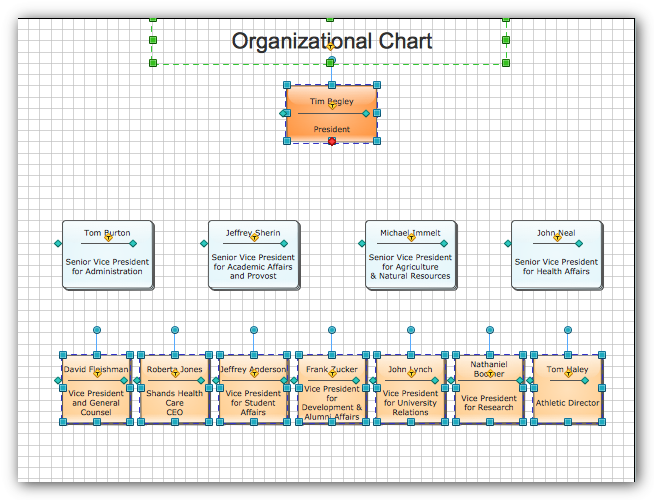
Blue crosses mark the connection points. Connection points won't be visible when printed or exported to a graphic file (same as the grid). If you don't want to see connection points, you can hide them using the View / Connection Points menu. To see how the document will look when printed, use the Print Preview button on the Main toolbar, or the corresponding command from the File menu.
Now you need to establish relationship between the shapes. For this it's more convenient to see the connection points of shapes. If connection points are hidden, enable them from the View / Connection Points menu.
Now, on the Drawing Tools toolbar choose the Smart Connector.
- Move the mouse pointer to the bottom connection point of the Headquarters shape. The connection point will be marked as a red cross.
- Click and hold the mouse button, and drag the mouse to the right connection point of the shape, that denotes the Strategy department.
- Release the mouse button.
By manipulating the handles you can reshape the connectors as needed for your drawing.
Connect all other shapes in the same way. Adjust the connectors so that they look as on the original chart.
The result must looks as follows:
